Autopilot Flight Path BFO Error Analysis
Yap Fook Fah
2015 March 24
(Updated 2015 April 20 to make the BTO and BFO Calculator available online: see reference [4] added at the very end.)
A downloadable PDF of this report (867 kB) is available here.
- Background
This report presents a Burst Frequency Offset (BFO) data error analysis of the end-game flight path of MH370 constrained by certain autopilot flight modes. The analysis is broadly similar in approach to that outlined in the ATSB reports [1, 2], but from which crucial quantitative results are not available for independent study.
Recall that the current search area is mainly defined by a compromise between two methods of analysis: “Constrained Autopilot Dynamics” (CAD), and “Data Error Optimisation” (DEO), as outlined in [1].
The CAD method assumes that the flight, at least after 18:40 UTC, was on some autopilot mode, and its range is limited by the amount of remaining fuel and aircraft performance. The ATSB report did not specify the time and location of the final major turn to the south. Further, the report did not provide details on how the generated paths were scored according to their “statistical consistency with the measured BFO and BTO values” [2].
In contrast, the DEO method does not take into account the flight mode, but simply seeks to rank a set of curved flight paths according to the deviation of the calculated BFO for each candidate flight path from the recorded values at the arc crossings after 18:40 UTC.
One problem is that the results from the two analyses are not quite consistent with each other. In particular, the DEO results imply that paths ending in the southern half of the CAD probability curve should be ranked much lower and be given less weight. In consequence, this has led to a compromise in the definition of the search area: “Area of interest on 0019 arc covers 80% of probable paths from the two analyses at 0011 …” [1]. This has the effect of shifting the search region further north than if only the CAD results were considered (see Figure 1 below).
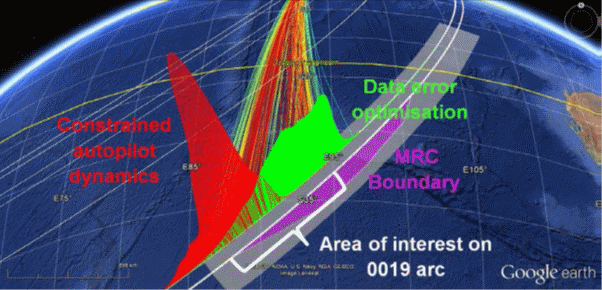
Figure 1: Defining the search area (from reference [1]).
- Objective
The objective of the present report is to reconstruct the end-game flight path BFO data error analysis with autopilot constraints, so as to obtain quantitative results for further evaluation and comparison with other types of analysis.
- Methodology
- A set of flight paths is generated starting from different locations on the 19:41 arc, each location being reachable from the last known radar position at 18:22 with the aircraft flying at feasible speeds.
- Each path is a rhumb line (or loxodrome) corresponding to a constant true track autopilot mode. The exercise is repeated assuming great circle paths (geodesics). The WGS84 model for the shape of the Earth is used.
- Each path is assumed to be flown at constant altitude. The exercise is repeated with an assumed rate of descent starting at 00:11 UTC (2014 March 08) that minimizes the BFO error.
- All paths cross the arcs at the recorded times, and therefore match the Burst Timing Offset (BTO) values exactly.
- The ground speed is allowed to vary. The speed profile is derived using a cubic polynomial function fitted over the five points at 19:41, 20:41, 21;41, 22:41 and 00:11. Integration of the speed over time gives the correct distance values at the arc crossings.
- A BFO fixed frequency bias of 150.26 Hz is used [3].
- The BFO values at the five arc crossings are calculated and compared to the recorded BFO values. The root-mean-square (RMS) error for each path is then calculated.
- Results
Figures 2 through 5 are based on the paths southwards after 19:41 being rhumb lines (i.e. loxodromes), whereas Figures 6 and 7 are based on the modelled paths being great circles (i.e. geodesics).
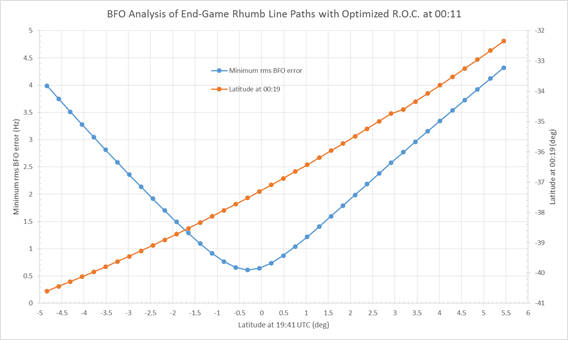
Figure 2 shows, as a function of the assumed aircraft latitude at 19:41, (a) the variation of the minimum RMS BFO error; and (b) the latitude attained at 00:19, based on the rate of descent at 00:19 being optimized (i.e. the BFO value at that time being fitted).
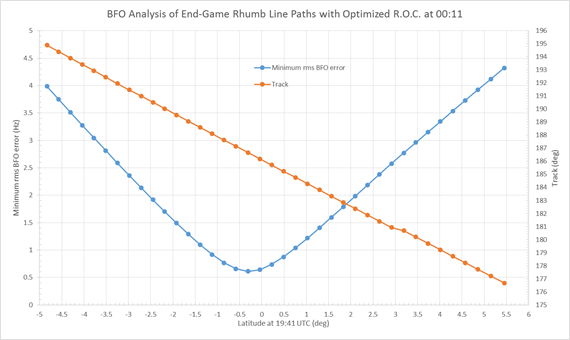
Figure 3 is similar to Figure 2, but represents the azimuth of the derived rhumb line path from the position at 19:41.
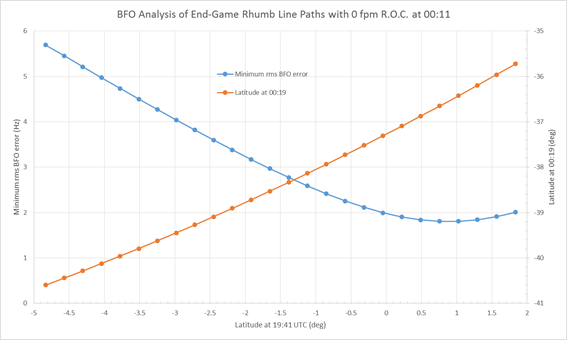
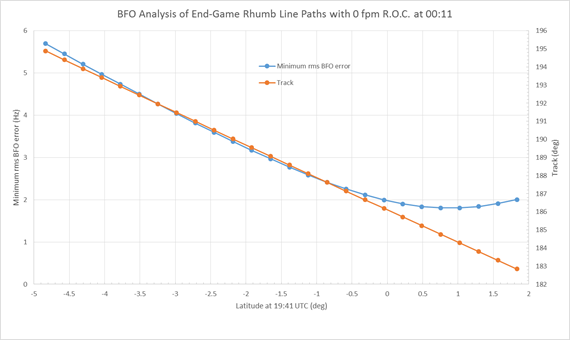
Figures 4 and 5 are similar to Figures 2 and 3 except that they result from assuming no descent (a level flight) at 00:11.
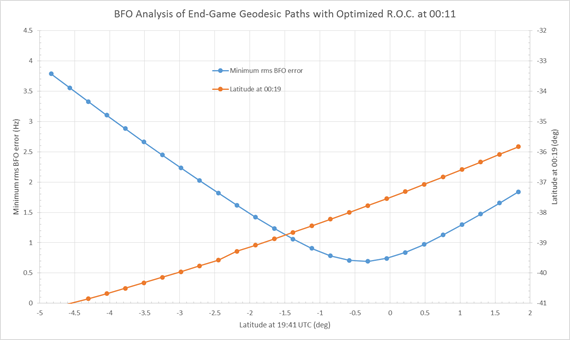
Figure 6, for a great circle path as described above, is similar to Figure 2 in that the minimum RMS BFO error and the latitude attained at 00:19 is depicted, based on the rate of descent at 00:19 being optimized.
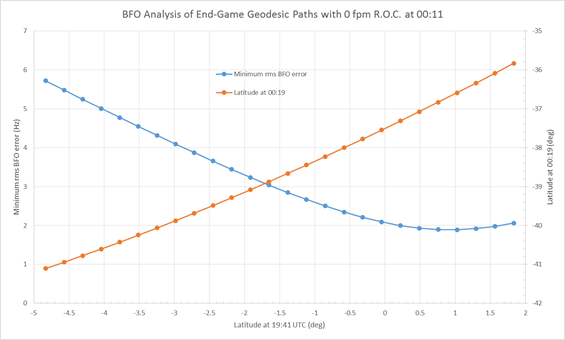
Figure 7 is similar to Figure 3: the minimum RMS BFO error and the latitude attained at 00:19 is depicted, based on no descent (a level flight) at 00:11.
Obviously there are no graphs/figures for constant azimuths in the case of these great circle (geodesic) paths because such paths have constantly-changing azimuths.
Figure 2: Rhumb line paths with optimized rate of descent at 00:11
indicating possible latitudes attained at 00:19.
(Note: R.O.C. means ‘Rate Of Climb’, which has negative values for a descent.)
Figure 3: Rhumb line paths with optimized rate of descent at 00:11
indicating possible azimuths of such paths.
Figure 4: Rhumb line paths based on a constant altitude/no descent
at 00:11, indicating possible latitudes attained at 00:19.
Figure 5: Rhumb line paths based on a constant altitude/no descent
at 00:11, indicating possible azimuths of such paths.
Figure 6: Geodesic paths based on an optimized rate of descent at 00:11
indicating possible latitudes attained at 00:19.
Figure 7: Geodesic paths, based on a constant altitude/no descent
at 00:11, indicating possible latitudes attained at 00:19.
The most important points from the results shown in Figures 2 through 7 may be summarized as in Table 1:
Table 1: Summary of results
Two interesting observations may be made concerning the optimum rhumb line path:
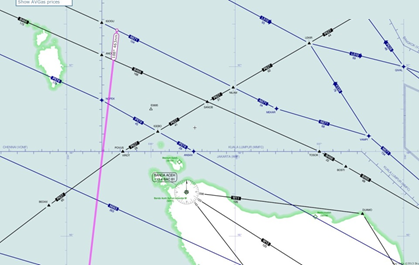
- If that path is extended back towards the north from 19:41, it passes close to waypoints ANOKO and IGOGU, as shown in Figure 8 below.
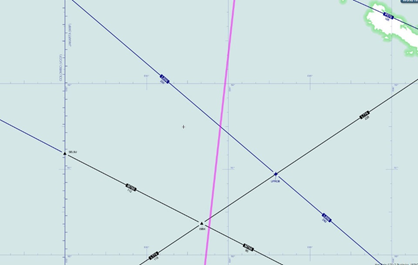
- Examining that path as it moves southwards on azimuth 186.6T, it is found to pass close to waypoint ISBIX, as shown in Figure 9 below.
A Skyvector plot of the overall optimum rhumb line path is available from here.
Figure 8: Propagating the optimum rhumb line flight path back northwards from 19:41.
Figure 9: The optimum rhumb line flight path passes close to waypoint ISBIX.
- Conclusions
The calculations presented here are based on a BFO error analysis assuming both (i) rhumb line/loxodrome; and (ii) great circle/geodesic paths, but without assuming any particular location and time of the final major turn. These calculations lead to a prediction of a set of likely flight paths and locations of the aircraft at 00:19, which have been ranked according to the RMS BFO error.
It is estimated that the path with the smallest RMS BFO error has a constant azimuth (i.e. is a rhumb line) of 186.6 degrees True; an end-point location (i.e. position at 00:19) that is near (-37.5, 89.0); and a course that passes close to the three waypoints IGOGU, ANOKO and ISBIX.
The sensitivity of the RMS BFO error to changes in track and end-point location from the optimum solution appears to be quite low; consequently any location from latitude -34.5 to latitude -40.5 lying along the 7th ping arc cannot be ruled out based on BFO error analysis alone. The search zone could possibly be reduced further by considering other factors such as aircraft performance. That is, this analysis has been based on DEO alone (allowing curved paths), with no CAD considerations involved (except for allowable paths being limited to rhumb lines or geodesics).
The analysis discussed herein could be further refined by considering the sensitivity to BTO errors, the fixed frequency bias utilized in the BFO analysis, and the rate of climb along the path (which has been assumed here to be zero – level flight – through until at least 00:11). This is beyond the scope of the current work, but preliminary studies suggest that the general conclusions reported here still hold.
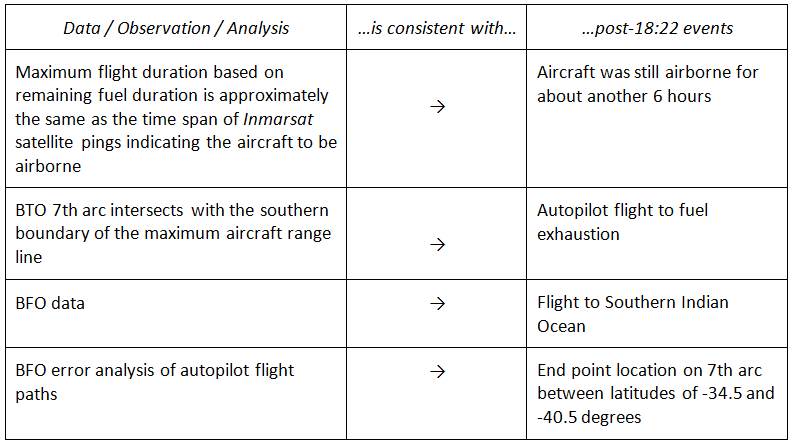
Finally, it is to be emphasized that the analysis and results presented here are based on the standard interpretation of the BTO and BFO data. Assuming that the BTO and BFO data are reliable, the following Table 2 summarizes a compelling argument for a flight by an autopilot mode to the Southern Indian Ocean (SIO).
Table 2: Summary of arguments for an autopilot flight
to the Southern Indian Ocean.
- Acknowledgements
I thank all members of the Independent Group (IG) for the active discussion and comments which have greatly helped me to understand much of the information that supports this analysis.
- References
[1] ATSB (Australian Transport Safety Bureau) report (08 October 2014): Flight Path Analysis Update.
[2] ATSB (Australian Transport Safety Bureau) report (26 June 2014; updated 18 August 2014): MH370 – Definition of Underwater Search Areas.
[3] Richard Godfrey (19 December 2014): MH370 Flight Path Model version 13.1.
