Some Observations on the Radar Data for MH370
by Victor Iannello, ScD,
August 18, 2015
A PDF of this paper is available for download from here (720 kB).
Please note: The views expressed here belong solely to Victor Iannello and do not necessarily represent the collective view of the Independent Group (IG), or any other group or individual.
Summary
This work analyzes the position and time data derived from the publicly-available radar data for MH370. Some of the findings are:
- After the turn back towards the Malay Peninsula, the flight path recorded by civilian primary surveillance radar (PSR), civilian secondary surveillance radar (SSR), and military radar are consistent with a flight at a Mach number (M) equal to 0.84 at a cruising level of FL340.
- If the aircraft did fly at a steady M = 0.84, then the timestamps for some of the PSR contained in the Factual Information (FI) [1] are offset by about 35 s.
- After the left turn at around 17:23:38 UTC, the aircraft might have descended from FL350 to FL340 and accelerated from a ground speed of 473 kn to a ground speed of greater than 500 kn.
- In the FI [1], the PSR data between 17:47:02 and 17:52:35 UTC are attributed to the radar site at Kota Bharu, but more likely were collected by another radar site. The PSR data between 17:30:37 and 17:44:52 are correctly attributed to Kota Bharu.
- In the FI [1], it is stated that Indonesian military radar recorded MH370 as it traveled toward IGARI but not as it traveled back over Malaysia. One explanation is that Indonesian radar site was powered down after midnight, local time.
- The sharp turn to the left at around 17:23:38 UTC is unexplained, and could be due to either an inaccurate graphical portrayal of the radar track, or crossing radar tracks from two aircraft.
- The curve in the radar path close to Kota Bharu can be explained by “slant range” due to high altitudes and close distances.
- Fuel consumption models which assume that MH370 flew near Long Range Cruise (LRC) speeds and at cruising altitudes between 17:07 and 18:22 are likely accurate.
The estimated path for MH370 from takeoff to the last radar point is shown in Figure 1.
Introduction
After the SSR data were lost from MH370 at 17:21:13, the only quantitative data that have been publicly disclosed are the PSR data that were collected by the radar head at Kota Bharu Airport, selected military radar data from one or more undisclosed radar sites, and the signaling data from the Inmarsat satellite network. In this work, we take a closer look at the radar data by individually treating the following four segments of the path:
- The known path northwest over the Malay peninsula ending with the last SSR data point at 17:21:13 just after passing IGARI
- The change in direction that started at 17:21:13 and ended with the resumption of the PSR data at 17:30:37, as captured by military radar
- The southwest path over the South China Sea, over Kota Bharu, and ending just south of Penang Island, as attributed in the FI [1] to the PSR data from Kota Bharu
- The northwest path over the Malacca Strait, as captured by military data
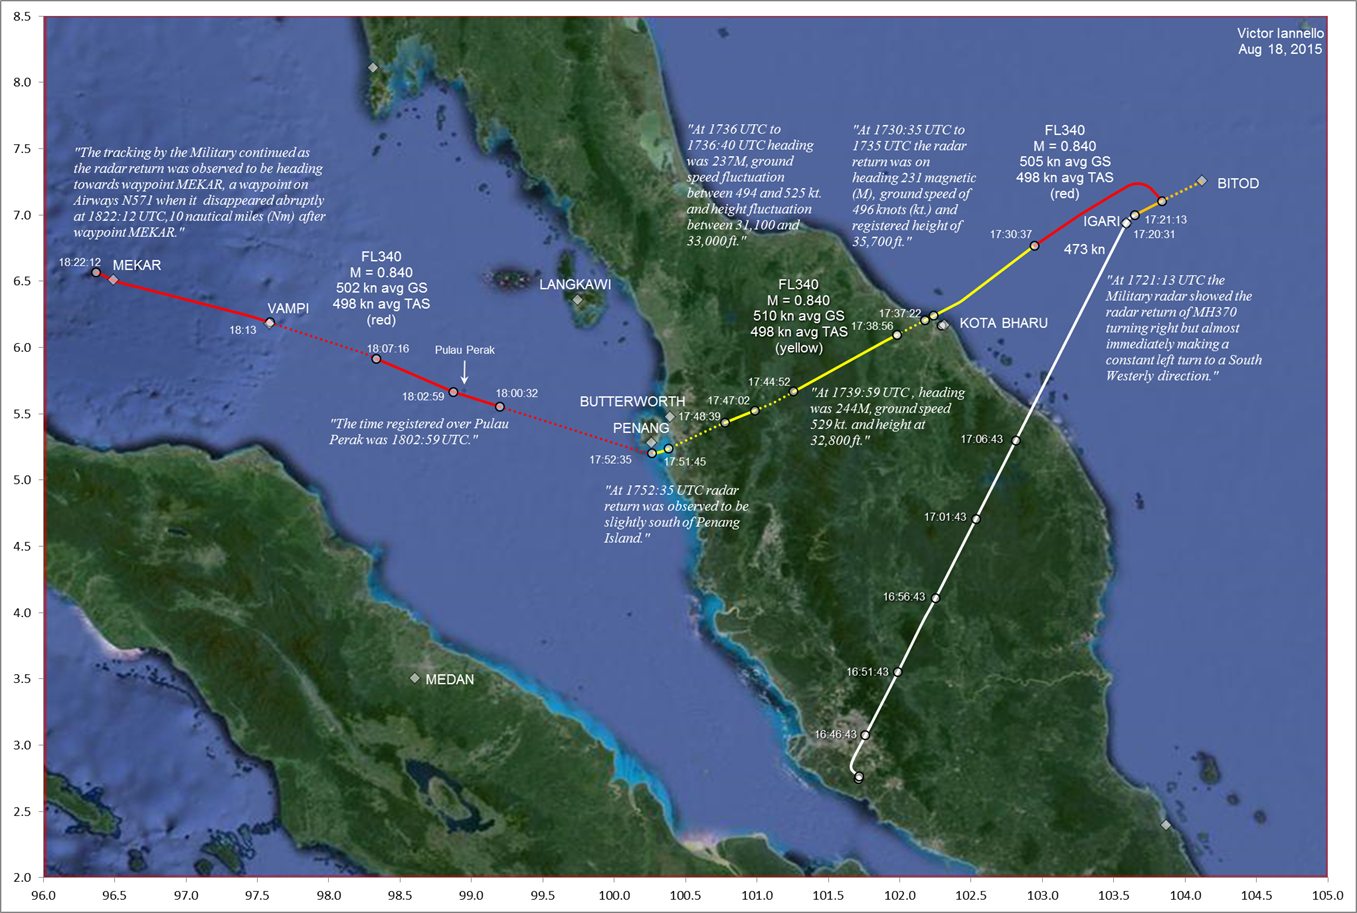
Figure 1. Summary of Radar Data
Solution Procedure
After analyzing timestamps, positions, and speeds for individual segments of the flight path, it was decided that the imprecision of the measured data precludes accurately determining the speeds for the individual segments due to the short time intervals and uncertainty in position and time. Instead, we hypothesized that the Mach number and altitude were essentially constant from the time of the left turn until the last radar point in the Malacca Strait, and then we tested whether this hypothesis is consistent with the data that was measured between the first and last data points.
In order to simulate the path of MH370 over the entire interval, an Euler integrator was used. For the segments of the path where there were turns, a time step of 1 s was used, and a 1-min time step was used for straight parts of the flight. The track angle was allowed to vary from time step to time step by imposing turn rates, expressed in units of deg/s. In this way, realistic curvature of the path could be modeled. The speed was adjusted so that two points are pinned in time and space: the left turn at 17:23:38 UTC, and the last radar point at 18:22:12 UTC. By iteratively varying the speed and the turn rates, a match of the flight path was obtained.
In order to properly include the effects of temperature and wind on the calculation, meteorological data were included in the analysis. The meteorological data for March 8, 2014 at 00:00 UTC [2] for a pressure altitude of 34,000 ft (FL340) were extracted from the GDAS archive provided by Barry Martin. This tabulated data has a spatial resolution of 1 deg in latitude and longitude. The wind data were used without alteration, but the temperatures were adjusted by -1.98 K / 1000 ft for altitudes equal to and less than FL360. (The tropopause for the ISA is at FL361.)
It was found that a constant true air speed (TAS) of 498 kn satisfies the time and distance relationship after accounting for wind. At FL350 and the prevailing temperature, this corresponds to M = 0.844. This is a higher speed than recommended for the B700-200ER to achieve Long Range Cruise (LRC) fuel efficiency. On the other hand, TAS = 498 kn corresponds to M = 0.840 at FL340, which is a more typical speed for cruising with a B777-200ER [3]. Therefore, we assume that MH370 likely flew at FL340, which required a descent of about 1000 ft after its last recorded value of FL350. An even cruising level such as FL340 is generally required of westbound flights in Reduced Vertical Separation Minimum (RVSM) airspace, such as within the Kuala Lumpur FIR. At the prevailing conditions on that day, FL340 corresponds to a geometric altitude of about 36,000 ft.
As a rough check of the validity of the tabulated wind and speed data, we can compare it to the data that were measured by the aircraft and included in the ACARS report at 17:06:43 [1]. At FL350, the temperature was 229.4 K and the wind speed was 17 kn from a direction of 70 deg. For the position of the aircraft at this time, the meteorological data predicts a temperature of 229.1 K and a wind speed of 15 kn from a direction of 67 deg. Therefore, the measured and tabulated temperatures match well, and the wind data values are also close.
Northwest Path over Malay Peninsula
The path of MH370 out of Kuala Lumpur International Airport (KLIA) and over the Malay Peninsula was captured by PSR and SSR data from the civilian radar site at Kota Bharu, as well as by ACARS data transmitted over the Inmarsat satellite network at 16:41:43, 16:46:43, 16:51:43, 16:56:43, and 17:06:43 UTC. The FI [1] reports that radar data showed that the aircraft passed over IGARI at 17:20:31 UTC, and the last SSR data position was recorded at 17:21:13 UTC, at which time the ground speed was 473 kn.
In order to quantitatively analyze the PSR data from Kota Bharu, the image of the PSR from the FI was positioned and sized on Cartesian coordinates using the waypoints PHUKET, MEDAN, PENANG, IGARI, and MERSING as registration points, where the position of the waypoints could be discerned from the image by the intersection of airways. The result is shown in Figure 2.
As can be seen in Figure 2, the agreement between the PSR (underlying black), SSR (white line), and the ACARS (white circles) data is excellent.
The FI [1] states that the Indonesian ATC in Medan, Sumatra, did not record an SSR transponder signal from MH370. Indonesian military radar did record MH370 as it headed towards IGARI but recorded nothing after the turn back towards Malaysia. As the aircraft left KLIA at around 16:41 UTC and passed IGARI at around 17:21 UTC, it appears that Indonesian radar lost the signal in that time interval, corresponding to 23:41 to 00:21 local time in Sumatra. One possibility is that at midnight, the military radar sites in Sumatra were powered down.
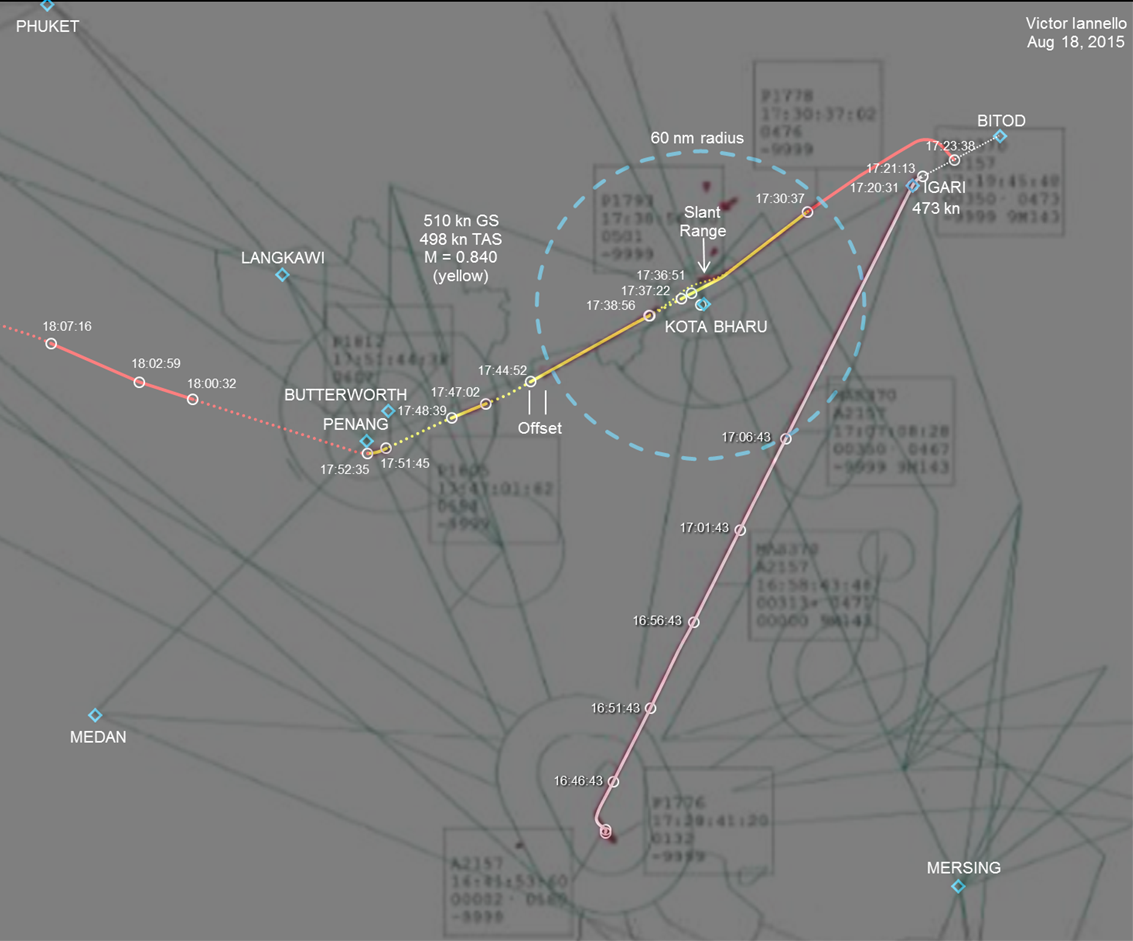
Figure 2. Primary Surveillance Radar (PSR) Data
Southwest Path over Malay Peninsula
Also included in Figure 2 is the PSR data from the time it reappears at 17:30:37 UTC to the last point at 17:52:35, for a total time interval of 21 min 58 sec, or 21.9667 min. Over that duration, the PSR data consist of four segments separated by three gaps in the data. From the FI [1], the time at the start and end of each segment is known, and is shown in Figure 2.
Figure 2 shows the calculated path (yellow) for the time interval. The meteorological data indicates that over the interval of the southwest path, there was an average tailwind of 12 kn at the indicated altitude. Therefore, at the true air speed of 498 kn, the average ground speed was around 510 kn.
According to the FI [1], the speed recorded by the military data was between 494 and 529 kn and the “registered” (geometric) altitude was between 31,100 ft and 35,700 ft. These values are not far from the proposed values of 510 kn and 36,000 ft. The deviation is likely due to the inaccuracy in obtaining speed and altitude information from the military radar data.
The times for the start and end of the four segments are shown in Figure 2 for the reconstructed path. In this way, it is possible to compare the position of the aircraft with the radar data at these times. It can be observed that for the first three segments, there is an offset between the radar data (underlying black) and the reconstructed path (yellow). The offset corresponds to about 35 s of flight time. For the fourth segment south of Penang, there is little or no offset. One explanation is that this offset is due to a delay between the time the radar contact was acquired at the radar head in Kota Bharu and when it was stored at the Kuala Lumpur ATC, although the detailed knowledge of how the data are aggregated and stored is not known.
A radar site estimates the distance between the radar head and the aircraft by measuring the round trip time for the transmitted radio signal and relating the time-of-flight to a distance based on the speed of light. As such, the radar is measuring the range between the radar head and the aircraft rather than measuring the distance along the ground. The radar range is sometimes referred to the “slant range” as it represents the hypotenuse of a triangle, where the altitude and the ground distance are the legs. The radar range and the distance will differ when the aircraft is at a distance that becomes comparable to the altitude of the aircraft, in which case a straight path towards and from the radar head will be appear on a radar screen as curved.
The effect of radar slant can be seen in Figure 2 as the aircraft approaches Kota Bharu around 17:34. The solid yellow line represents the reconstructed flight path, and the curved dotted line represents the slant range. The predicted slant range follows the trend of the radar data, as represented by the underlying black line. This suggests that the flight path truly was straight as it passed Kota Bharu.
Change in Direction from Northeast to Southwest
The military radar data presented in Figure 2 of the ATSB Report [4] from June 26, 2014, are used to reconstruct the path of MH370 after passing IGARI. The military data from the ATSB report are used as an overlay, and the coast of Malaysia is used for registration of the overlay. The result is shown in Figure 3.
The path is assumed to follow a trajectory towards BITOD at the last recorded ground speed of 473 kn until a sharp turn commences at around 17:22:52. The military data show an impossibly steep turn that would indicate that the graphical representation in the figure is not accurate or the radar data has been misrepresented. It is possible that the sharp radar track is actually crossing radar tracks from two separate aircraft. These hypotheses merit further investigation, and will be the subject of future work.
After the steep turn, the path is reconstructed with the assumption that the plane is flying at M = 0.84 and FL340. For this portion of the flight, this corresponds to a true air speed of 498 kn and a ground speed of 505 kn. The turn represents a rate of about 1 deg/s, which at 498 kn corresponds to a bank angle of about 24.5 deg. This is within the allowable limits of automated flight for a B777.
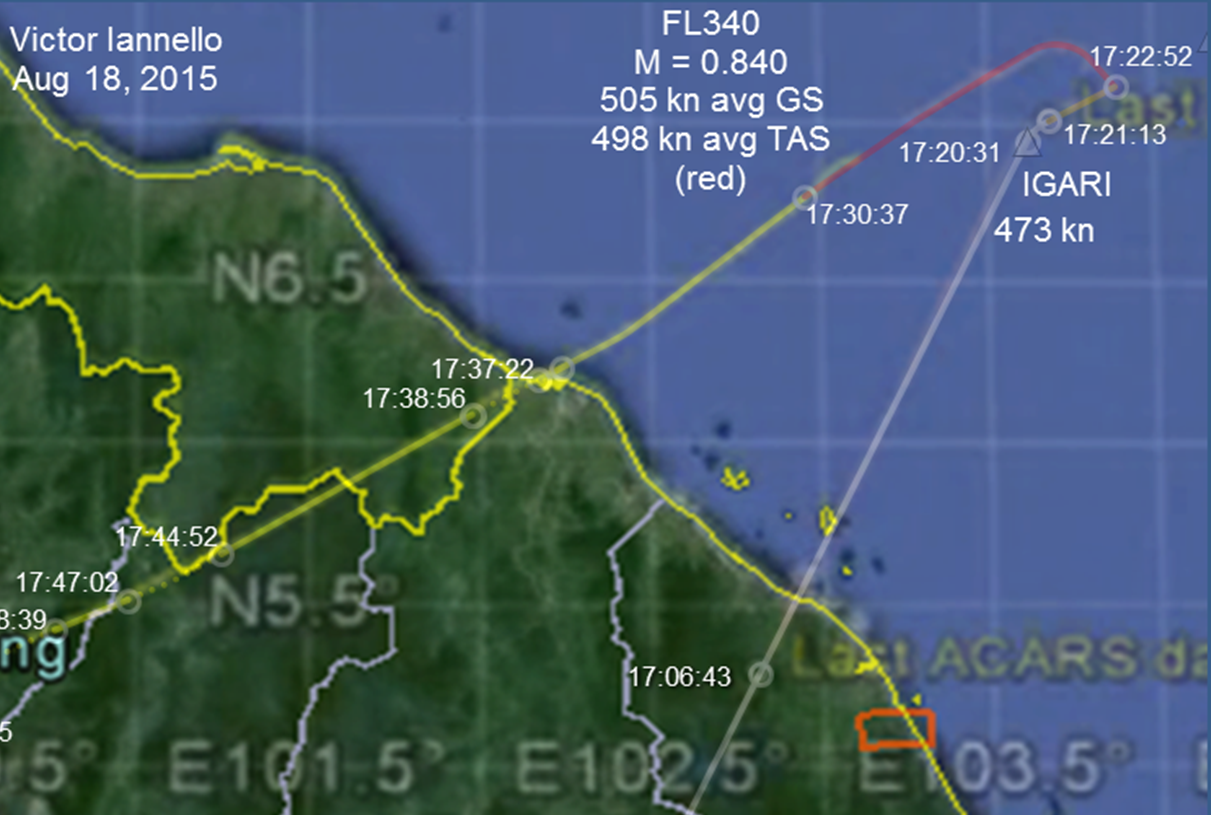
Figure 3. Military Radar Data for Left Turn after IGARI
Northwest Path over the Malacca Strait
On March 21, 2014, officials from Malaysia made a presentation to the next-of-kin at the Lido Hotel in Beijing. Several photographs were taken of slides from this presentation, including a slide presented by a Lieutenant General from the Malaysia Royal Air Force which showed an image of the military radar data over the Malacca Strait [5]. Here, we rely upon the work of Ron Belt [6], who performed an earlier study of the radar data over the Malacca Strait and extracted the radar data from this slide and produced several helpful figures.
In Figure 4, one of the figures from [6] was used as on overlay, where the waypoints VAMPI, MEKAR, PENANG, and LANGKOWI are used for registration. Using a speed of M = 0.84 and a cruising level of FL340, turns were adjusted to match the radar data. The ground speed averages 502 kn over this interval, and the calculated position at 18:22:12 UTC matches the position of the last radar point on airway N571.
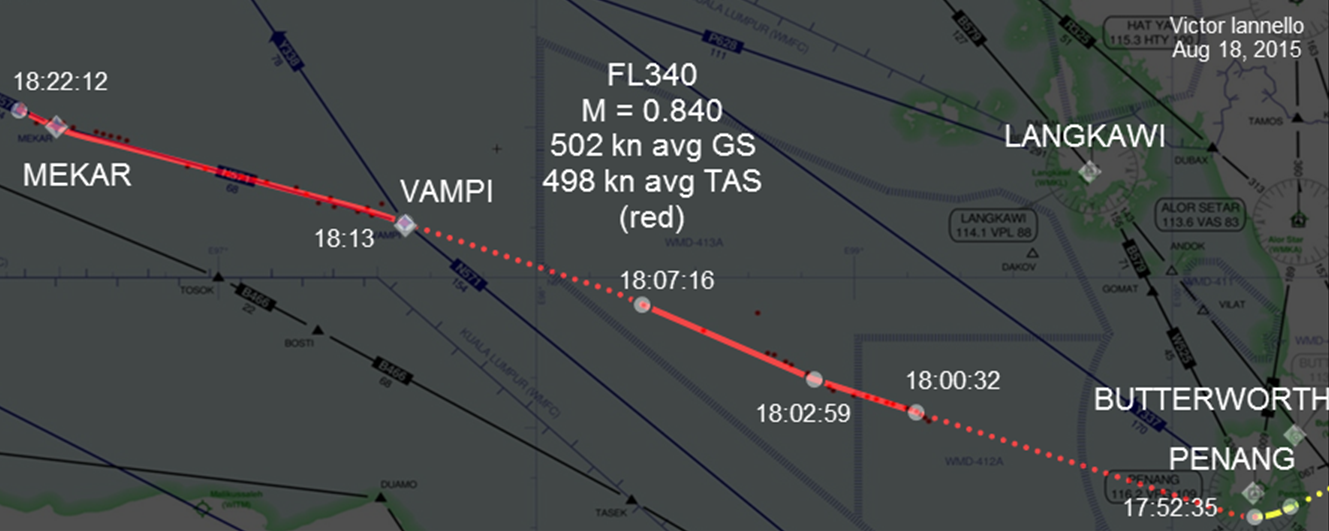
Figure 4. Radar Data over the Malacca Strait
Conclusion
After MH370’s turn back towards the Malay Peninsula, the flight path recorded by civilian primary surveillance radar (PSR), civilian secondary surveillance radar (SSR), and military radar are consistent with a flight at a Mach number (M) equal to 0.84 at an altitude of FL340. With this assumption, some anomalies that were identified include an impossibly sharp turn to the left after passing IGARI, and timestamp inconsistencies as recorded by the PSR data from Kota Bharu. As MH370 likely flew at efficient cruise speeds and altitudes during the time it was captured by radar, fuel consumption models that assume fuel flow rates based on LRC conditions during this time interval are likely accurate. For instance, at FL350 and LRC conditions, the Mach number would vary between 0.838 and 0.834 over this interval [3].
Acknowledgements
The author wishes to thank fellow IG members Mike Exner, Don Thompson, Sid Bennett, Barry Martin, Richard Godfrey, Tom Kenyon, and Henrik Rydberg for reviewing this report and providing insightful comments.
References
[1] Malaysian ICAO Annex 13 Safety Investigation Team for MH370, “Factual Information, Safety Investigation for MH370”, March 8, 2015, updated April 15, 2015.
[2] Barry Martin, Meteorological data for March 8, 2014, http://www.aqqa.org/MH370/models/NCEP/GDAS_FNL/gdas2014030800f00.txt
[3] Boeing, “Flight Crew Operating Manual, 777-200ER, Trent892”, June 16, 2008.
[4] Australian Transport Safety Bureau (ATSB), “MH370 – Definition of Underwater Search Areas”, June 26, 2014.
[5] Don Thompson, “Analysis: Malaysian Radar Surveillance Capabilities”, June 18, 2014, http://bit.ly/TUDM_ADS
[6] Ron Belt, “Analysis of Malaysian Radar Data”, May 29, 2014.